Introducing the Basedash Dashboard Agent
Max Musing
 Max MusingFounder and CEO of Basedash
· April 30, 2026
Max MusingFounder and CEO of Basedash
· April 30, 2026
Max Musing
Max MusingFounder and CEO of Basedash
· April 30, 2026
Today we’re launching the Dashboard Agent, the first AI agent that can build an entire dashboard end-to-end.
You describe a dashboard in plain English, and the agent picks the chart types, writes the SQL, lays everything out, and hands you something useful in seconds. You no longer have to compose a board chart by chart, naming each metric, choosing each visualization, and arranging the grid by hand.
When we first launched Basedash, our vision was to be the most AI-native BI platform on the planet. Back then, the state of the art was text-to-SQL inside the query editor of a single chart. We had a prototype of a full-dashboard agent on day one, but it wasn’t good enough to ship.
So we waited, and invested in our internal harness, the schema understanding, the planning loop, and the small details that make AI-generated charts feel hand-crafted. As the models and our own system improved, the gap between “describe a chart” and “describe a dashboard” closed.
The Dashboard Agent is the result: the workflow we always wanted Basedash to have, and the one we believe every team should expect from a modern BI tool.
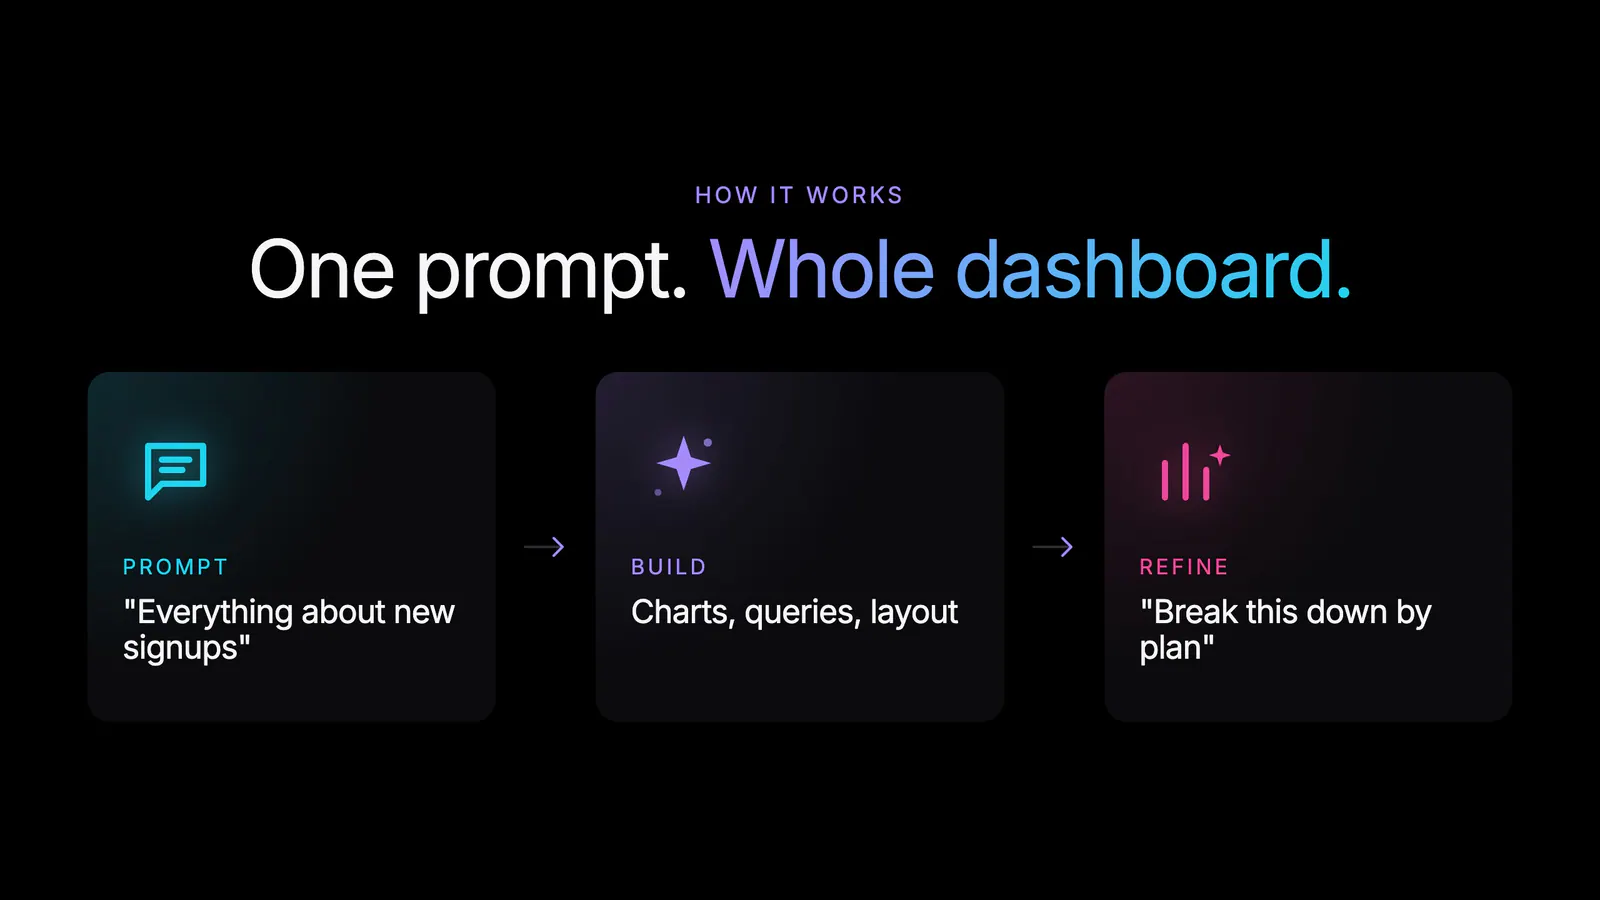
Tell the agent what you want to see, and it handles the rest:
A vague prompt gets a thoughtful default, and a prescriptive one gets what you asked for. Either way, you have a useful dashboard in seconds instead of an afternoon.
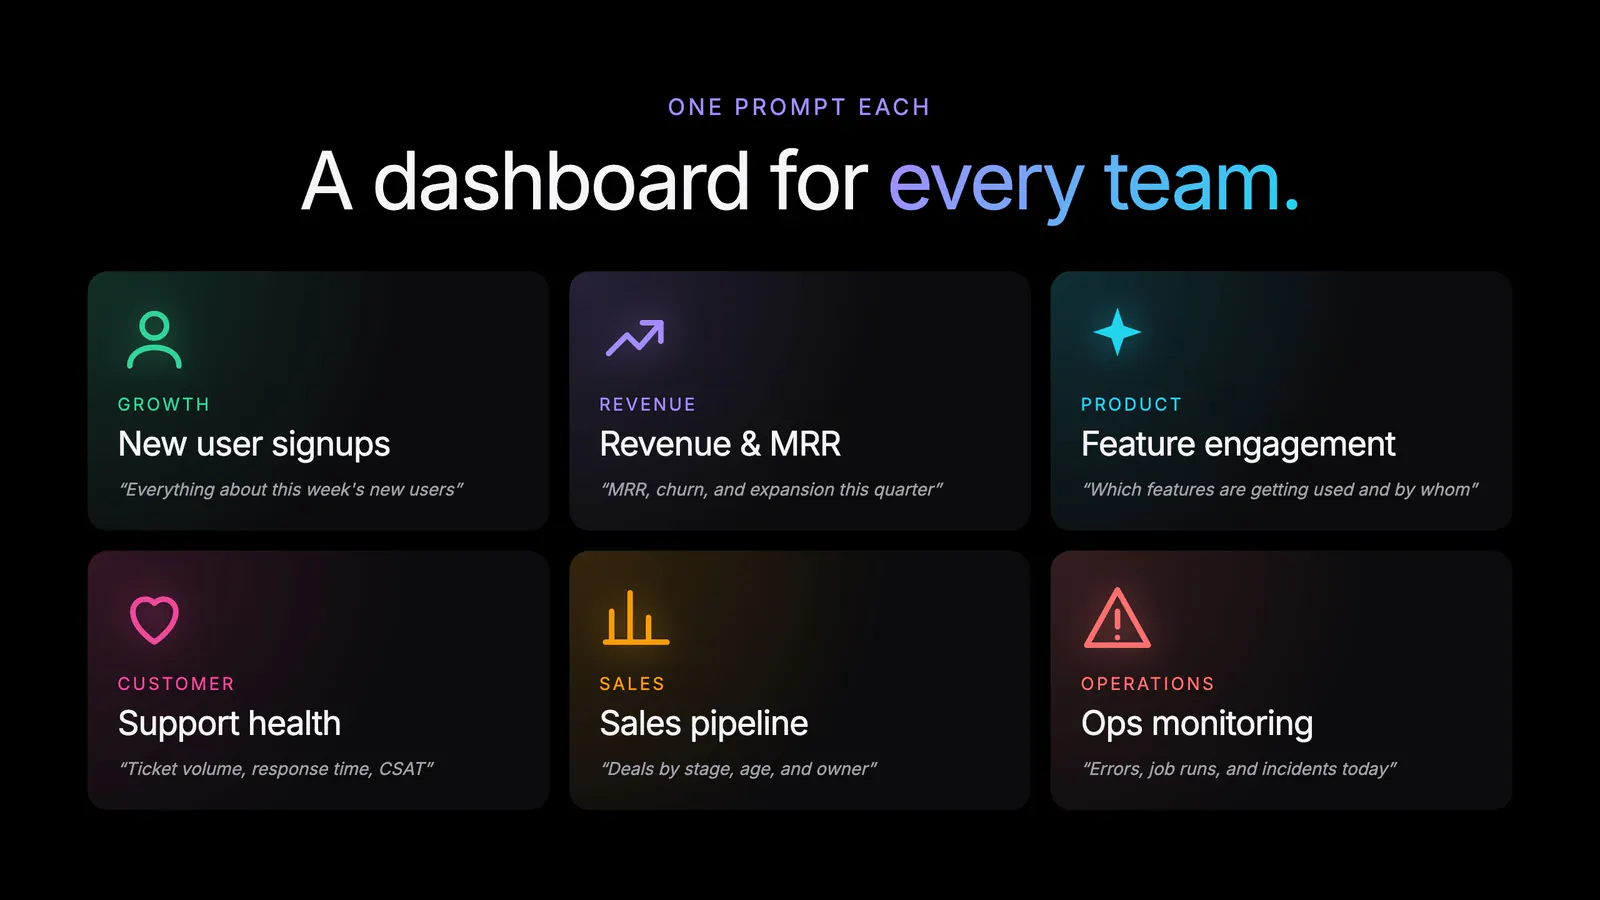
The Dashboard Agent works for any team and any prompt shape. A few examples we’ve seen internally:
You can stay vague and let the agent infer what matters, or pin down the exact metrics, time windows, and breakdowns you want. The output adapts to the level of detail you bring.
We’ve been running the Dashboard Agent internally for months. Across every team, dashboards that used to be afternoon projects are now something we ask for before a meeting.
Before a growth review, someone types out the slice they want and the dashboard exists by the time the call starts. When a support spike shows up in Slack, we generate a board around it, share the link, and dig in together. When a new feature ships, instead of waiting for a data analyst to wire up tracking views, we describe what success looks like and the agent assembles a starting point we can iterate on.
These dashboards also stick around. Because every chart is a real Basedash chart, the boards we generate quickly become the ones we use day to day. The agent gets us 80% of the way there in seconds, and the last 20% is the kind of refinement humans should be doing anyway.
The Dashboard Agent is available today for all Basedash users.
For more on what’s possible, see the Dashboards feature page or the docs.
The Dashboard Agent is a major step toward our vision of an AI-native BI platform, where the people closest to a question build the answer themselves.
Alongside AI chat for ad-hoc questions, Insights for proactive findings, and Automations for scheduled workflows, Basedash now covers every part of how teams work with data: ask, build, monitor, and deliver.
We’re excited to see what you build with it.
Try the Dashboard Agent today by describing a dashboard you need.
Written by

Founder and CEO of Basedash
Max Musing is the founder and CEO of Basedash, an AI-native business intelligence platform designed to help teams explore analytics and build dashboards without writing SQL. His work focuses on applying large language models to structured data systems, improving query reliability, and building governed analytics workflows for production environments.
Basedash lets you build charts, dashboards, and reports in seconds using all your data.